

For NetApp Solidfire aka H-Series (ElementOS) there’s a Techical-Report, how to get your capacity and performance data into nice Grafana dashboards. That’s pretty cool, but Grafana itself cannot do any alarming. We are still using Nagios or Iciniga for our monitoring and alarming, so we needed a solution how to include the Solidfire storages into our monitoring system.
I’ve written some perl scripts, for monitoring elementOS with Nagios or Icinga over the API:
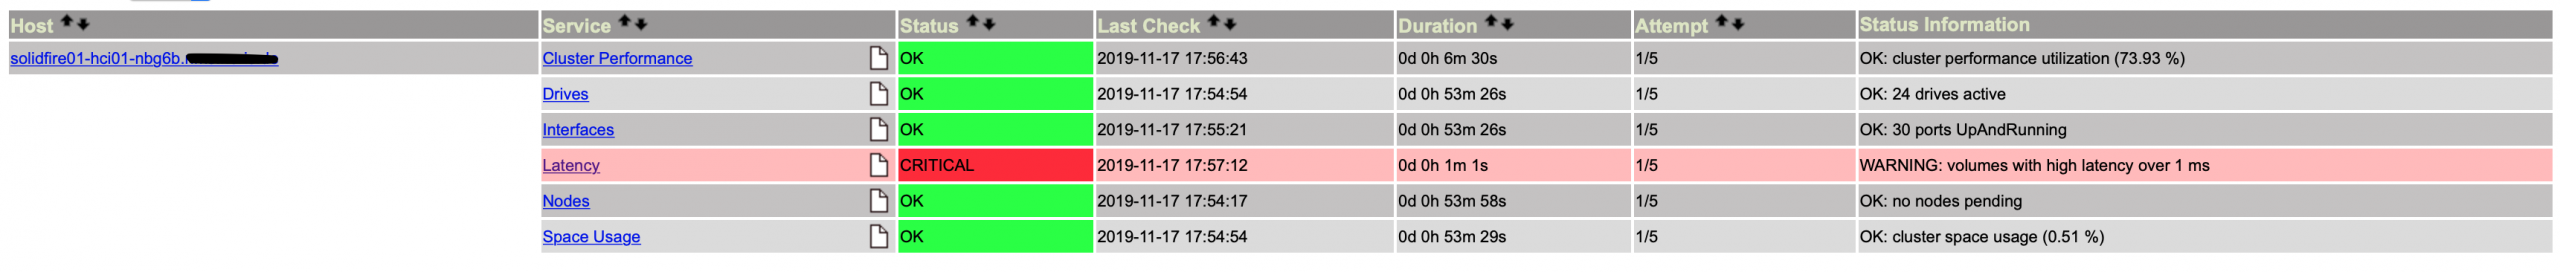
At the moment, the following check are ready to use:
- Cluster Performance Headroom
- SSD Drive Status
- Interface Status
- Volume Latency
- Node Status
- Cluster Space Usage (Block and Meta)
Next step will be monitoring for protection domains – means you will get an alarm, if the cluster is to full, that a single node or a complete chassis can fail without impact.
However: all scripts are just beta – so I’m looking forward to receive feedback and also feature requests from you 🙂
Many Thanks!