

One of my oldest IT articles from about 2005 🙂
Introduction
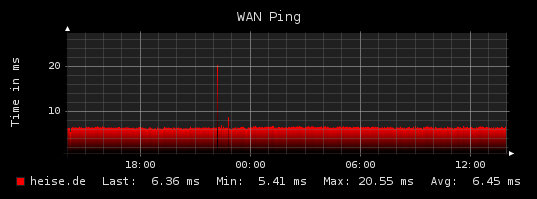
This HOWTO describes how to quickly generate a nice graph, showing you the average ping time off a specific host. This picture is the result we should get:
This setup consists of 4 steps
* Configfile
* RRDcreate
* RRDupdate
* RRDgraph
Configfile
The config file defines some global variables that will be used inside the other scripts.
rrd.conf:
 #!/bin/bash

 RRDTOOL='/data/rrd/bin/rrdtool'
 FILE='/data/rrd/db/ping.rrd'
 HOST='heise.de'
 OUTPUT='/data/rrd/png/ping.png'
RRDTOOL Path to RRDtool binary
FILE Path to the .rrd database file
HOST Host to ping
OUTPUT Path to the Image
RRDcreate
We need a Round Robin Database to collect the data. Following script will create a RRD file that will accept values every 60 seconds and that can hold one day’s worth of samples. For further explanation about creating Round Robin Databases please refer to the RRDcreate manpage.
create.sh:
 #!/bin/bash

  . /data/rrd/etc/rrd.conf

 $RRDTOOL create $FILE -s 60 \
 DS:ping:GAUGE:120:0:65535 \
 RRA:AVERAGE:0.5:1:2880
RRDupdate
The next step is a script which updates the Round Robin Database. This script must run every 60 seconds, for exemple via crontab or a loop (while true; do update.sh; sleep 60; done). For further explanation about updating Round Robin Databases please refer to the RRDupdate manpage.
update.sh:
 #!/bin/bash

  . /data/rrd/etc/rrd.conf

 UPDATECMD=$(ping -c 3 -w 6 $HOST | grep rtt | awk -F "/" '{ print $5 }' )

 $RRDTOOL update $FILE N:$UPDATECMD
In the first step the script reads in the variables from the configfile.
. /data/rrd/etc/rrd.conf
The second step is the command which pings the host. ping -c 3 -w 6 makes 3 pings and stop after 6 seconds if no ping returns. After that it builds the average of the 3 pings
UPDATECMD=$(ping -c 3 -w 6 $HOST | grep rtt | awk -F "/" '{ print $5 }' )
The last step updates the Round Robin Database with the current timestamp (N) and the result ping gives.
$RRDTOOL update $FILE N:$UPDATECMD
RRDgraph
The last script creates the graph itself. For further explanation about graphing Round Robin Databases please refer to the RRDgraph manpage.
graph.sh:
 #!/bin/bash

 . /data/rrd/etc/rrd.conf

 $RRDTOOL graph $OUTPUT \
         -t "WAN Ping" -v "Time in ms" \
         --start="now-1d" \
         --end="now" \
         --height="120" \
          --width="440" \
         -c "BACK#000000" \
         -c "SHADEA#000000" \
         -c "SHADEB#000000" \
         -c "FONT#DDDDDD" \
         -c "CANVAS#202020" \
         -c "GRID#666666" \
         -c "MGRID#AAAAAA" \
         -c "FRAME#202020" \
         -c "ARROW#FFFFFF" \
         "DEF:ping_time=$FILE:ping:AVERAGE" \
         "CDEF:shading2=ping_time,0.98,*" "AREA:shading2#F90000:$HOST" \
         "GPRINT:ping_time:LAST:Last\: %5.2lf ms" \
         "GPRINT:ping_time:MIN:Min\: %5.2lf ms" \
         "GPRINT:ping_time:MAX:Max\: %5.2lf ms" \
         "GPRINT:ping_time:AVERAGE:Avg\: %5.2lf ms" \
         "CDEF:shading10=ping_time,0.90,*" "AREA:shading10#E10000" \
         "CDEF:shading15=ping_time,0.85,*" "AREA:shading15#D20000" \
         "CDEF:shading20=ping_time,0.80,*" "AREA:shading20#C30000" \
         "CDEF:shading25=ping_time,0.75,*" "AREA:shading25#B40000" \
         "CDEF:shading30=ping_time,0.70,*" "AREA:shading30#A50000" \
         "CDEF:shading35=ping_time,0.65,*" "AREA:shading35#960000" \
         "CDEF:shading40=ping_time,0.60,*" "AREA:shading40#870000" \
         "CDEF:shading45=ping_time,0.55,*" "AREA:shading45#780000" \
         "CDEF:shading50=ping_time,0.50,*" "AREA:shading50#690000" \
         "CDEF:shading55=ping_time,0.45,*" "AREA:shading55#5A0000" \
         "CDEF:shading60=ping_time,0.40,*" "AREA:shading60#4B0000" \
         "CDEF:shading65=ping_time,0.35,*" "AREA:shading65#3C0000" \
         "CDEF:shading70=ping_time,0.30,*" "AREA:shading70#2D0000" \
         "CDEF:shading75=ping_time,0.25,*" "AREA:shading75#180000" \
         "CDEF:shading80=ping_time,0.20,*" "AREA:shading80#0F0000" \
         "CDEF:shading85=ping_time,0.15,*" "AREA:shading85#000000" >/dev/null
The first sections are settings about the graph’s labels, size and colours.
 $RRDTOOL graph $OUTPUT \

         -t "WAN Ping" -v "Time in ms" \
         --start="now-1d" \
         --end="now" \
         --height="120" \
         --width="440" \
         -c "BACK#000000" \
         -c "SHADEA#000000" \
         -c "SHADEB#000000" \
         -c "FONT#DDDDDD" \
         -c "CANVAS#202020" \
         -c "GRID#666666" \
         -c "MGRID#AAAAAA" \
         -c "FRAME#202020" \
         -c "ARROW#FFFFFF" \
The variable ‘ping_time’ gets defined as ping in the Round Robin Database.
"DEF:ping_time=$FILE:ping:AVERAGE" \
The first CDEF is the last line and that one which has the description under it.
"CDEF:shading2=ping_time,0.98,*" "AREA:shading2#F90000:$HOST" \
This sections puts out the legend under the graph.
 "GPRINT:ping:_timeLAST:Last\: %5.2lf ms" \
 "GPRINT:ping_time:MIN:Min\: %5.2lf ms" \
 "GPRINT:ping_time:MAX:Max\: %5.2lf ms" \
 "GPRINT:ping_time:AVERAGE:Avg\: %5.2lf ms" \
This last part does the actual grading. By calculating percentages out of the original value we can draw layers of areas with different colors. This makes the nice effect of a color gradient
 "CDEF:shading10=ping_time,0.90,*" "AREA:shading10#E10000" \
 "CDEF:shading15=ping_time,0.85,*" "AREA:shading15#D20000" \
 "CDEF:shading20=ping_time,0.80,*" "AREA:shading20#C30000" \
 "CDEF:shading25=ping_time,0.75,*" "AREA:shading25#B40000" \
 "CDEF:shading30=ping_time,0.70,*" "AREA:shading30#A50000" \
 "CDEF:shading35=ping_time,0.65,*" "AREA:shading35#960000" \
 "CDEF:shading40=ping_time,0.60,*" "AREA:shading40#870000" \
 "CDEF:shading45=ping_time,0.55,*" "AREA:shading45#780000" \
 "CDEF:shading50=ping_time,0.50,*" "AREA:shading50#690000" \
 "CDEF:shading55=ping_time,0.45,*" "AREA:shading55#5A0000" \
 "CDEF:shading60=ping_time,0.40,*" "AREA:shading60#4B0000" \
 "CDEF:shading65=ping_time,0.35,*" "AREA:shading65#3C0000" \
 "CDEF:shading70=ping_time,0.30,*" "AREA:shading70#2D0000" \
 "CDEF:shading75=ping_time,0.25,*" "AREA:shading75#180000" \
 "CDEF:shading80=ping_time,0.20,*" "AREA:shading80#0F0000" \
 "CDEF:shading85=ping_time,0.15,*" "AREA:shading85#000000" >/dev/null
Alex – thank you for your scripts. I was looking for a way to dump in per-second data into a ping script for RRD and this was exactly what I was looking for (with a few modifications.) With newer versions of RRDtool – gradients come built in… So I updated to just be:
“CDEF:shading2=ping_time,0.98,*” “AREA:shading2#990099#ffff00:$HOST”
Thanks again!!
Hm, it looks like with having 0.98* as the first line, it looks like you were missing on the last 2%. A line with the given values therefore is slightly above the shaded area.
Thanks a lot for putting this up, there’s many beautiful graphs – and almost *no* info on how to obtain these, so this was immensely valuable for me.